Provide/increase anti-poaching patrols
-
Overall effectiveness category Likely to be beneficial
-
Number of studies: 7
View assessment score
Hide assessment score
How is the evidence assessed?
-
Effectiveness
65% -
Certainty
60% -
Harms
0%
Study locations
Supporting evidence from individual studies
A study in 2003–2007 in forest in a national park in central Thailand (Jenks et al. 2012) found that, close to ranger stations, deer and small mammals were more abundant than further away. Sambar deer Rusa unicolor, red muntjac Muntiacus muntjak and a range of small prey species were more likely to be found close to ranger stations than further away (modelled result – data not presented). Poachers were also more likely to be found within 5 km of ranger stations than further away within the national park. Authors suggest that this may be due to roads making ranger stations more accessible and possibly complicity of ranger staff. The national park was 2,168 km2 in area. Camera traps were operated in 217 locations over 6,260 total trap nights from October 2003 to March 2007, to survey animals and poacher presence. Cameras were placed across 22 park management zones.
Study and other actions testedA before-and-after study in 1997–2008 in a protected area dominated by secondary Atlantic forest in Brazil (Flesher & Laufer 2013) found that implementing ranger patrols increased mammal abundance and reduced hunting pressure. After the introduction of patrols by rangers, mammal abundance was higher (8.7 encounters/10 km walked) than before ranger patrols (5.1 encounters/10 km walked) and hunting pressure was lower (after: six encounters; before: 24 encounters). In May 1997–August 2004 and October 2007–November 2008, forest trails were censused for medium-sized and large mammals. A single observer walked at approximately 1 km/hour along trails 3–5 km long, pausing every 50 m to listen for animal sounds, and using binoculars and a headlamp at night to detect animals. Day censuses began within an hour of sunrise and night censuses within an hour of sunset. In total, 233 km of transects were walked.
Study and other actions testedA study in 2011–2013 in a steppe site in a national park in Iran (Ghoddousi et al. 2015) found that presence of ranger stations, which were bases for anti-poaching patrols, was associated with increased numbers of urial sheep Ovis vignei and Persian leopards Panthera pardus saxicolor. The density of urial sheep decreased with increasing distance from ranger station. This distance was also the best predictor of sheep flock sizes, which were larger closer to ranger stations. Leopards were also more likely to be found closer to ranger stations, though leopard abundance was best explained by urial sheep density. Results were presented as model coefficients. Urial sheep numbers and distribution were determined by distance sampling, along 186 km of line transects, surveyed from 22 January–19 February 2013, 15 August–8 September 2013 and 21–24 February 2014. Leopards were surveyed using 29 camera traps in January–March 2011.
Study and other actions testedA before-and-after study in 2005–2012 in a tropical dry forest reserve in the Western Forest Complex, Thailand (Duangchantrasiri et al. 2016) found that as anti-poaching patrols intensified, poaching incidents decreased, but the estimated tiger Panthera tigris abundance did not change significantly over seven years. The estimated tiger abundance was similar seven years after poaching patrols started to increase (56 tigers) compared to the year before poaching patrols started to increase (51 tigers). In the final two years of the study, when patrols were at their highest levels, there were 22 poaching incidents detected/1,000 km patrolled, compared to 24–30 incidents/1,000 km patrolled over the previous five years. The study was conducted in a 2,780-km2 reserve, adjacent to approximately 30 villages. In 2006–2012, there was an increase each year in the number of patrol days/year (from 1,031 in 2006 to 3,316 in 2012) and distance patrolled/year (5,979 km in 2006 to 12,907 km in 2012). Tigers were surveyed annually between 2005 and 2012, using camera traps across 524–1,094 km2 (137–2,000 locations/year, 910–3,869 camera-trap days/year). Paired camera traps were positioned along anticipated tiger travel routes.
Study and other actions testedA before-and-after study in 2007–2012 in a mainly grassland and forest protected area in Lao People's Democratic Republic (Johnson et al. 2016) found that increasing patrol intensity did not lead to higher tiger Panthera tigris abundance. Patrol effort was positively correlated with funding, but not with tiger abundance trends. The number of large tiger tracks (pads >7 cm wide) at the end of the six-year study period (3/1,000 km patrolled) was lower than that over the first three years (8/1,000 km patrolled). The proportion of collected carnivore scats that were from tigers decreased to 3.6% at the end of the study from 15.4–15.6% in the first two years. Patrol effort in a 5,950 km2 protected area increased from 1.7 days/part-time team in 2005–2007 to a peak of 22.7 days/full-time team in 2008–2009, then dropped by 4.2% in 2009–2012. Track data and scats were collected by foot patrols and other fieldworkers. Scats were identified to species by DNA analysis.
Study and other actions testedA study in 2011–2013 in a protected area in South Africa (Barichievy et al. 2017) found that where anti-poaching patrols were more common, poaching of African rhinocerous was also more common, but that there was no relationship between the amount of time rangers spent in a location and the likelihood of a poaching event. In areas that rangers visited more frequently, poaching of rhinocerous was more likely to occur. However, in areas where rangers spent more time patrolling, poaching was no more likely to occur. Data were reported as model results. Authors suggest that a range of factors, such as practicalities of access, may result in both more ranger visits and more poaching. Between September 2011 and September 2013, ranger locations were recorded at three-minute intervals in 0.25-km2 grid cells across the protected area. The location of rhinoceros poaching events, identified from monitoring by park authorities, was overlaid on to the same grid. The average frequency and duration of visits by rangers was calculated for each area where rhinoceros poaching occurred.
Study and other actions testedA site comparison study in 2012–2013 in two tundra sites in Tajikistan (Kachel et al. 2017) found that in an area where anti-poaching patrols were carried out, densities of snow leopard Panthera uncia, argali Ovis ammon polii, and ibex Capra sibirica were higher than in an area where no patrols were carried out. The area where anti-poaching patrols were carried out had a higher snow leopard density (0.7 individuals/100 km2) than where no patrols were carried out (0.5 individuals/100 km2). The same was true for argali (patrols: 11.0; no patrols: 0.1 individuals/100 km2) and ibex (patrols: 4.3; no patrols: 2.0 individuals/100 km2). One site was patrolled by 3–5 rangers year round. The other site was not patrolled. In June and September 2012, thirty-seven camera traps were deployed at the patrolled site and 34 in the unpatrolled site. Photographs were used to identify individual snow leopards. In September–October 2013, at both sites, 20 randomly selected locations were surveyed for 90 minutes and the abundance of all ungulate species was recorded.
Study and other actions tested
Where has this evidence come from?
List of journals searched by synopsis
All the journals searched for all synopses
This Action forms part of the Action Synopsis:
Terrestrial Mammal Conservation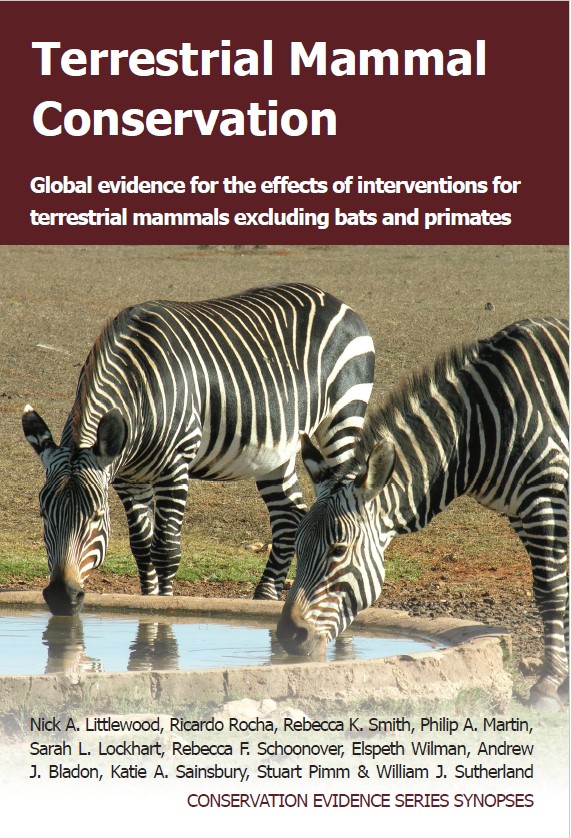
Terrestrial Mammal Conservation - Published 2020
Terrestrial Mammal Conservation



)_2023.JPG)


