Legally protect peatlands
-
Overall effectiveness category Likely to be beneficial
-
Number of studies: 5
View assessment score
Hide assessment score
How is the evidence assessed?
-
Effectiveness
60% -
Certainty
40% -
Harms
1%
Study locations
Supporting evidence from individual studies
A study in 1990–2004 of a national park in Indonesia, including peat swamp and lowland forest (Curran et al. 2004) reported that legal protection did not prevent deforestation. Gunung Palung National Park was designated in 1990. The rate of forest loss within the national park increased from 1,200 ha/year in 1994 to 9,000 ha/year in 2002. These estimates cover both lowland forest (on non-peat soils) and peat swamp forest, but deforestation did occur in both forest types (data presented as maps). Forest cover in the national park was mapped using satellite images (30 m resolution) taken between 1994 and 2002. Land cover classification was validated using finer resolution satellite images, aerial photographs and field surveys.
Study and other actions testedA before-and-after study in 1990–2009 of peatlands on the Zoige Plateau, China (Yao et al. 2011) reported that following legal protection of the Plateau, the area of peatland vegetation decreased initially but increased in the longer term. In 1990, the study area contained 4,143 km2 of peatland vegetation. The Plateau was designated as a Natural Reserve in 1994 then upgraded to a National Nature Reserve in 1998. In 2000, the area of peatland vegetation had shrunk by 18% to 3,407 km2. However, by 2009 this had increased by 5% to 3,589 km2. The area of peatland vegetation was calculated from satellite images. The study noted that grazing land has been abandoned since the Plateau was protected, although it is not clear to what extent this is directly related to the protection. The study also noted changes in temperature and rainfall over time.
Study and other actions testedA before-and-after study in 1844–2005 in a historically mined raised bog in Denmark (Kollmann & Rasmussen 2012) reported that following legal protection, the plant community changed over time in favour of woody species, whilst plants species richness fluctuated without trend. These results were not tested for statistical significance. Over 161 years of protection, the overall composition of the plant community changed (data reported as a graphical analysis). In particular, tree/shrub abundance increased (overall, and for 17 of 20 species). In 2005, the most common trees were downy birch Betula pubescens and common oak Quercus robur (both in 100% of monitored plots). The most common moss was Sphagnum fallax (in 14% of monitored cells). The number of vascular plant species in the bog fluctuated over time, with no clear trend (40 species before protection; 75 species after 41 years; 18 species after 127 years; 38 species after 161 years). In 1844, a mined bog was legally protected from further human use. Between 1844 and 2005, plant species were recorded in 18 permanent 113 m2 plots. In 2005, moss presence was recorded in six 0.25 m2 quadrats.
Study and other actions testedA site comparison study in 1973–2009 in peat swamp forest in Indonesia (Miettinen et al. 2013) reported that a legally protected area retained more forest cover than an adjacent unprotected area. The results were not tested for statistical significance. In the 1970s, 99% of Berbak National Park was covered by peat swamp forest (and 95% by nearly pristine forest). By 2009, total peat swamp forest cover had declined to 77% (and nearly pristine cover to 73%). However, these declines were smaller than outside the National Park (total: from 91 to 46%; nearly pristine: from 86 to 25%). In 2009, there were also fewer industrial plantations and smallholder farms inside the National Park (0% cover) than outside (21% cover). Land cover was mapped using satellite images (10–60 m resolution) taken between 1973 and 2009. The images covered 1,262 km2 of Berbak National Park (protected as a game reserve since 1935 and a Ramsar site since 1992) and 2,128 km2 of adjacent land.
Study and other actions testedA site comparison study in 2014 in a peatland in Chile (Cabezas et al. 2015) found that a protected area had greater vegetation cover and taller vegetation, but lower vascular plant richness and diversity, than an adjacent grazed and harvested area. The protected area had greater cover than the unprotected area of total vegetation (87 vs 62%), herbs (68 vs 51%) and shrubs (19 vs 11%) and contained taller vegetation (65 vs 13 cm). The protected area had lower vascular plant species richness than the unprotected area (7 vs 11 species/4 m2) and lower diversity (reported as a diversity index), but also contained fewer non-native species (<0.1 vs 1.9 species/4 m2). In 2014, vegetation cover and height were recorded in forty-four 2 x 2 m quadrats. Fifteen quadrats were in a protected part of a peatland (5.5 ha owned by a research station, fenced to exclude livestock for eight years and with no moss harvesting for at least 20 years). Twenty-nine quadrats were in an unprotected part (10.5 ha, grazed by four oxen and harvested every month).
Study and other actions tested
Where has this evidence come from?
List of journals searched by synopsis
All the journals searched for all synopses
This Action forms part of the Action Synopsis:
Peatland ConservationRelated Actions
| Actions | Effectiveness | Studies | Category | |
|---|---|---|---|---|
|
Adopt voluntary agreements to protect peatlands Action Link |
No evidence found (no assessment) | 0 |
|
|
|
Lobby, campaign or demonstrate to protect peatlands Action Link |
Unknown effectiveness (limited evidence) | 2 |
|
|
|
Increase ‘on-the-ground’ protection (e.g. rangers) Action Link |
Unknown effectiveness (limited evidence) | 1 |
|
Peatland Conservation - Published 2018
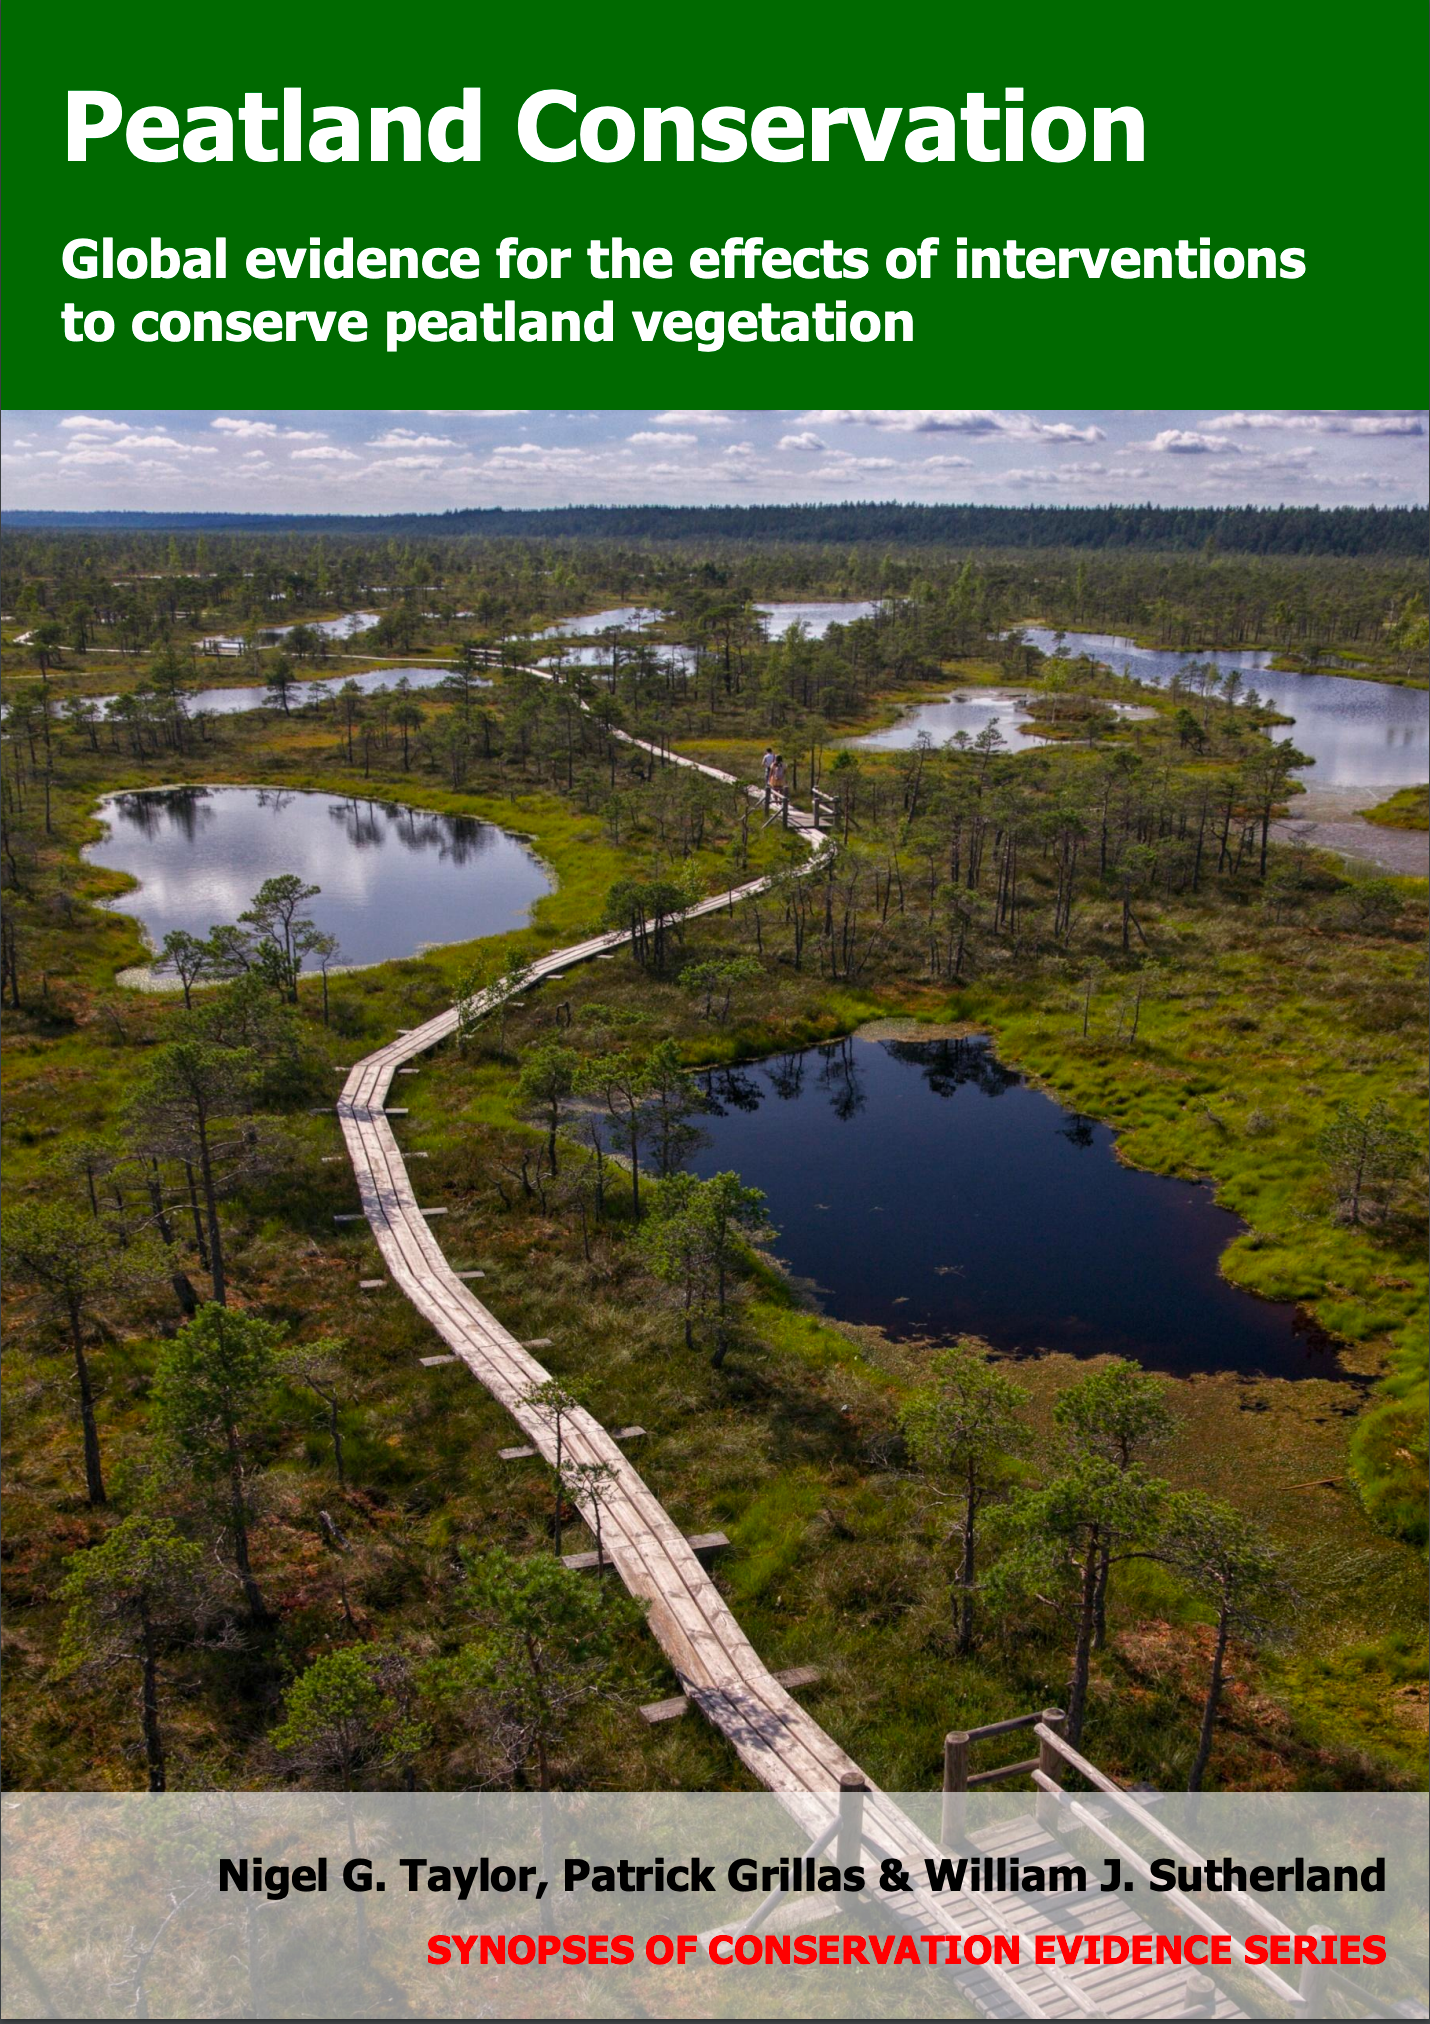
Peatland Conservation


)_2023.JPG)